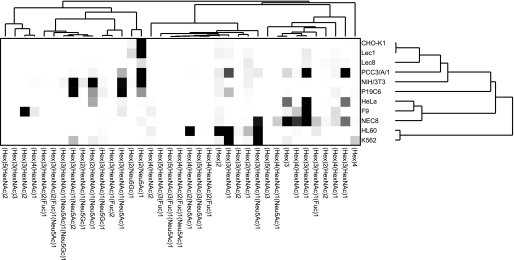
FIGURE 6.
Hierarchical clustering analysis of GSL-glycan expression profiles. Graphic representation of hierarchical clustering results based on expression profiles of 37 GSL-glycans in 11 cell types is shown. Rows, cell types; columns, GSL-glycans. Color intensity from white to red indicates the magnitude of differential expression.

