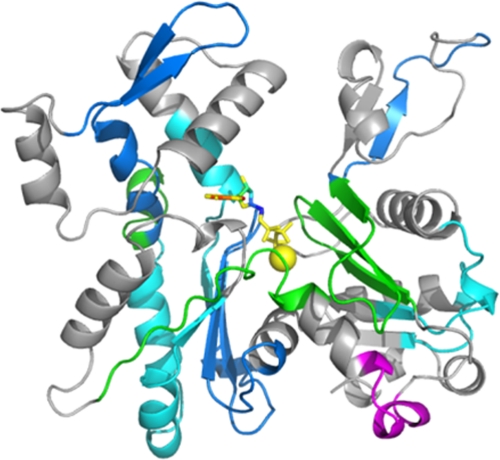
FIGURE 7.
Effects of A167E mutation on G-actin polypeptide backbone hydrogen-deuterium exchange detected by mass spectrometry. Samples of actin were placed in deuterated solvent, and aliquots were withdrawn over time. Following acid quenching of the exchange reaction, the proteins were digested on a pepsin column, and the resulting peptides were analyzed by mass spectrometry as described under “Experimental Procedures.” The color scheme shown represents the difference in extent of hydrogen-deuterium exchange between the A167E and WT G-actins using the data displayed in Table 3. Red and magenta signify extents of exchange between mutant and WT actin, noted as Δ, of at least 1 Da (Δ ≥1 Da) and between 0.1 and 1 Da (0.1 < Δ <1 Da), respectively. Green signifies exchange between 0.1 and −0.1 Da (−0.1≤ Δ ≤0.1 Da) in mutant compared with WT actin, which we take as equal exchange between the two samples. Blue and cyan signify decreased exchange of more than 1 Da (Δ ≤−1 Da) or between 1 and 0.1 Da (−1< Δ <−0.1 Da) in the mutant compared with WT actin, respectively. Gray indicates that the peptide was not detected in one or the other of the samples. The actin structural model used is Protein Data Bank code 1YAG.

