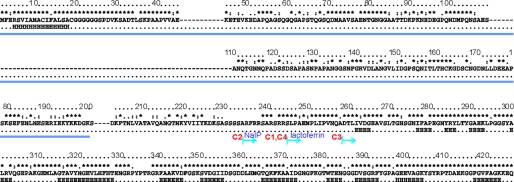
FIGURE 1.
Analysis of the NHBA sequence. For simplicity, only the sequence of the 2996 strain is reported but gaps are inserted according to the multiple alignment with other strains reported under supplemental Fig. S1. Marked on the top is the degree of conservation over the sequences of 18 different strains. Asterisks indicate complete conservation, colons and dots indicate positions conserved in 50 and 25% of the sequences, respectively. The consensus secondary structure as predicted by different servers is indicated below the sequence. H and E indicate helical and extended regions, respectively. The consensus region predicted as intrinsically unfolded by three different algorithms (Globplot, Disopred, and PONDR) as shown under supplemental Fig. S2 is underlined in blue. The starting points of the different constructs analyzed experimentally are indicated. They all run up to the end of the sequence. NHCA_C1 and NHCA_C4 differ by the presence of a C-terminal histidine tag in the former and cleaved off in the latter. The N termini of the NHCA_C1 and NHCA_C2 constructs coincide with the lactoferrin and NaIP cleavage sites, respectively.

