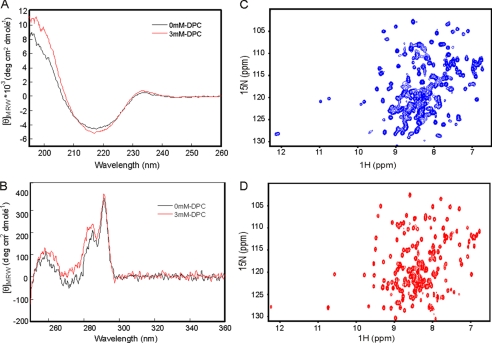
FIGURE 2.
CD and NMR spectra of NHBA_C1. Left panels, comparison of the far UV (A) and near UV (B) CD spectra recorded at 35 °C and in the absence (black trace) and presence (red trace) of 3 mm DPC. Right panels, comparison of the 15N-HSQC spectrum of NHBA_C1 recorded at 40 °C and 600 MHz in the absence (C) and presence (D) of 30 mm DPC.

