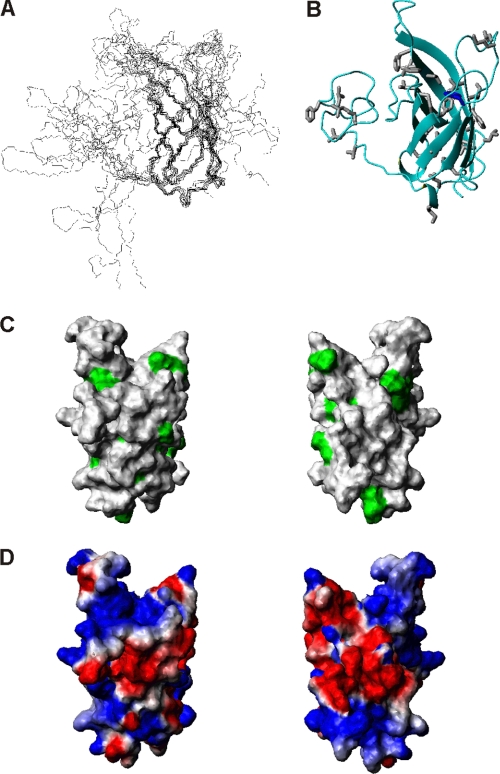
FIGURE 3.
Structure determination of the C-terminal domain of NHBA. A, bundle of the 10 best structures refined in water obtained by superimposing the backbone heavy atoms (N, Cα, and C′) of residues in structured regions (β1, 316–328; β2, 337–345; β3, 350–355; β4, 367–372; β5, 376–381; β6, 388–393; β7, 400–405; β8, 419–425). B, ribbon drawing of the mean structure of NHBA_C1. Structure averaging was obtained according to Ref. 50. C, exposed hydrophobic residues are marked in green on the surface of the NHBA domain. Only the structured region (residues 305 to 426) is shown for clarity. The two views differ by a 180 degree rotation around the y axis. D, electrostatic surface using the same orientations as in C.

