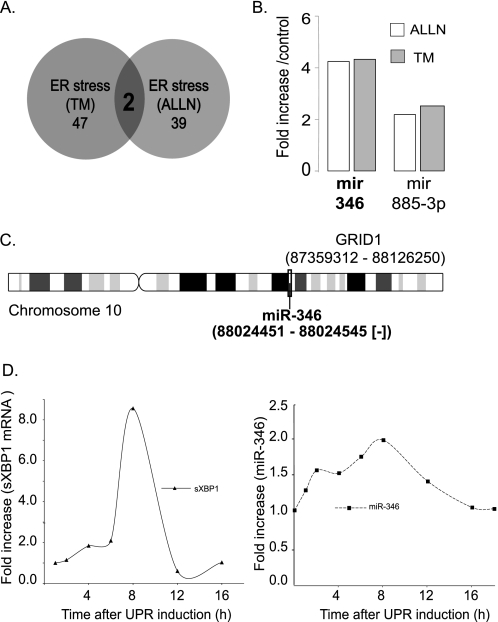
FIGURE 1.
miR-346 levels increase during ER stress. A, results of the miRNA profiling arrays. Calu-3 cells were treated with two different ER stressors, TM (5 μg/ml) and proteasome inhibition (ALLN, 100 μg/ml), for 12 h prior to isolation of RNA + miRNA and Affymetrix miRNA array hybridization. The Venn diagram illustrates that the number of miRNAs enhanced was 47 and 39 by TM and ALLN, respectively. Two miRNAs were induced by both mechanisms. B, relative increase in miR-346 and miR-885-3p levels. Two miRNAs, miR-346 and miR-885-3p, were enhanced by both ER stressors. miR-346 was selected for further studies based on the ∼4-fold increase by both ER stressors. C, chromosomal location of the miR-346 gene. The miR-346 gene is localized to human chromosome 10, in intron 2 of the GRID1 gene. The locations of GRID1 and miR-346 are indicated on the model of chromosome 10. D, time course studies on the elevation of sXBP1 mRNA and miR-346 levels following ER stress induction. Calu-3 cells were treated with TM (5 μg/ml) for the time periods indicated, and RNA + miRNA were isolated at the time points specified followed by qRT-PCR quantification of sXBP1 mRNA as reporter of UPR activation (left). miR-346 levels were measured at the time points indicated (right). Results are plotted as -fold increase in sXBP1 mRNA or miR-346 over control, prior to the addition of TM (n = 4).

