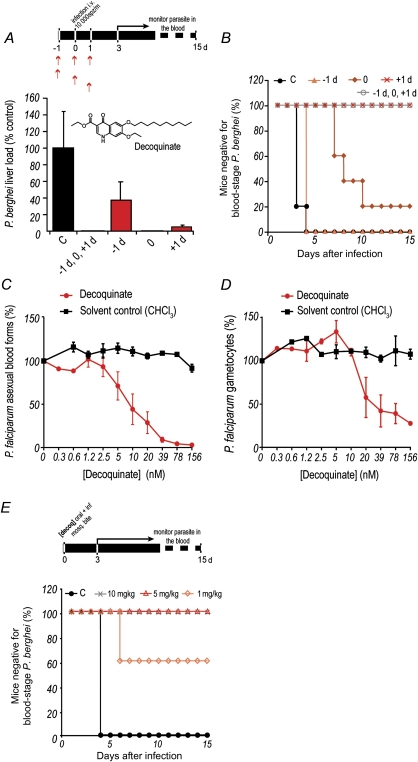
Figure 2.
Inhibition of Plasmodium by decoquinate. A, B, Oral administration of 10 mg/kg of decoquinate at various times relative to intravenous injection of 10 000 luciferase-expressing Plasmodium berghei sporozoites. Luminescence-based measurement of liver parasite loads are shown in A, and blood-stage patency of infection is shown in B. The inset depicts the structure of the decoquinate molecule. Results shown are representative from 3 independent experiments. Error bars represent SDs (n = 5). C, D, Half-maximal inhibitory concentration curves representing the effect of decoquinate on parasite (C) and gametocyte (D) load. Each assay represents at least 3 biological replicates with 2 technical replicates per plate. The graphs show mean values of the experiments, whereas the error bars represent the standard error of the mean. E, Blood-stage patency of infection in mice following oral administration of a single dose of decoquinate immediately prior to P. berghei sporozoite delivery by mosquito bite (n = 5). Abbreviation: C, control.

