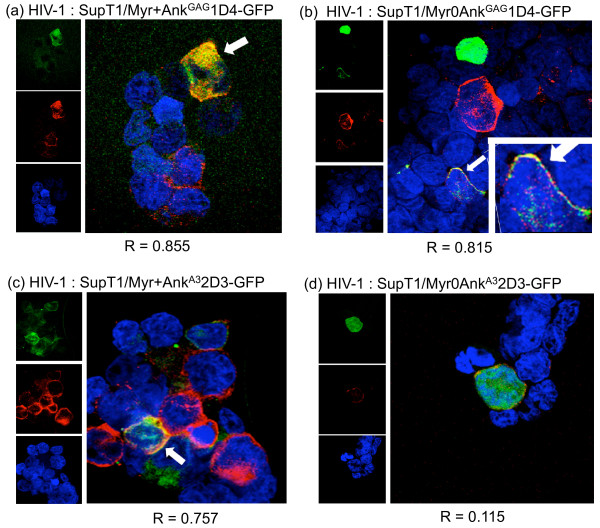
Figure 8.
Confocal microscopy of HIV-1-infected, ankyrin-expressing SupT1 cells. HIV-1-infected SupT1/Myr+AnkGAG1D4-GFP (panel a), SupT1/Myr0AnkGAG1D4-GFP (b), SupT1/Myr+AnkA32D3-GFP (c), and SupT1/Myr0AnkA32D3-GFP cells (d) were collected at day 11 pi, permeabilized, immunolabeled with anti-CAp24 mAb and PE-conjugated anti-mouse IgG F(ab')2 antibody (red signal), and nuclei counter-stained in blue with DAPI. Ankyrins were detected by their GFP-tag. Merged images are enlarged and shown on the right side of each panel. White arrows point to cells showing colocalization of ankyrin and Gag proteins. R, the Pearson correlation coefficient for signal colocalization, was determined using the Olympus FluoView software.

