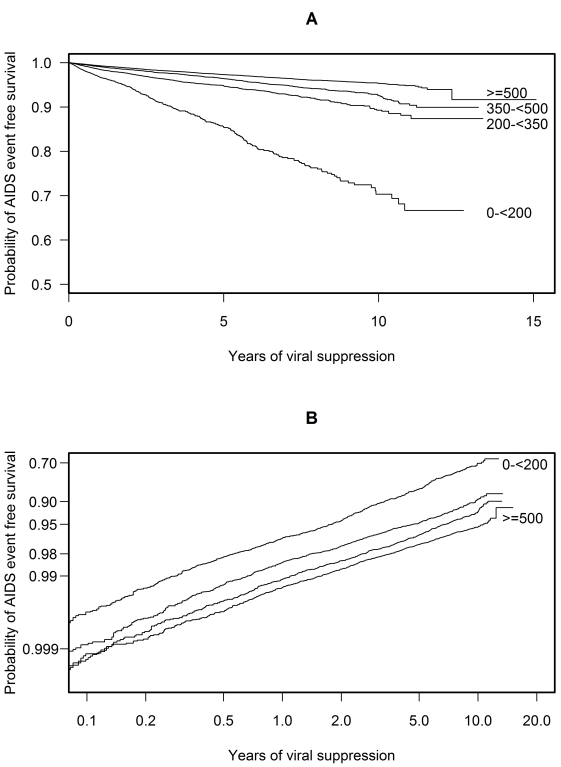
Figure 1. Probability plots of AIDS event-free survival over time.
These plots apply to hypothetical patients whose CD4 cell count remains within the same CD4 stratum while on cART with a suppressed viral load. Plot (A) shows a Kaplan Meier plot of the probability of AIDS event-free survival over time. Plot (B) shows a plot of log(−log [probability of AIDS event-free survival]) against log(time). The roughly parallel lines of plot (B) suggest that a proportional hazards model is appropriate for these data. Both plots use a method appropriate for a time-dependent CD4 cell count (see [16]).

