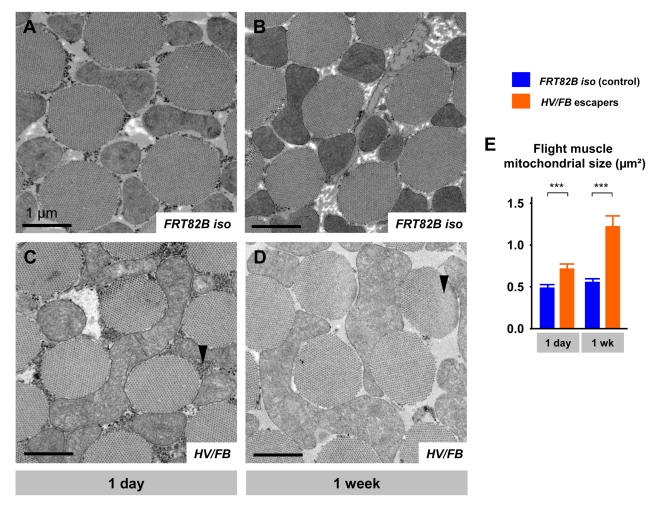
Figure 3. TEM of indirect flight muscle.
(A) TEM micrograph of 1-d-old control (FRT82B isogenized) flight muscle, with its characteristic myofibers surrounded by mitochondria and small glycogen granules. (B) Micrograph of 1-wk-old control muscle. (C) Micrograph of 1-d-old HV/FB escaper, with much larger mitochondria with poor cristae structure, and a high density of granules compared to control (arrowhead). (D) 1-wk-old escaper flight muscle, with a similar but more severe mitochondrial phenotype and a complete absence of granules. Myofibril degeneration is highlighted by the arrowhead. (E) Quantification of the average mitochondrial size between control (blue) and HV/FB (orange) escaper flight muscle, showing much larger mitochondria present in the mutants. Scale bars: 1 µm.

