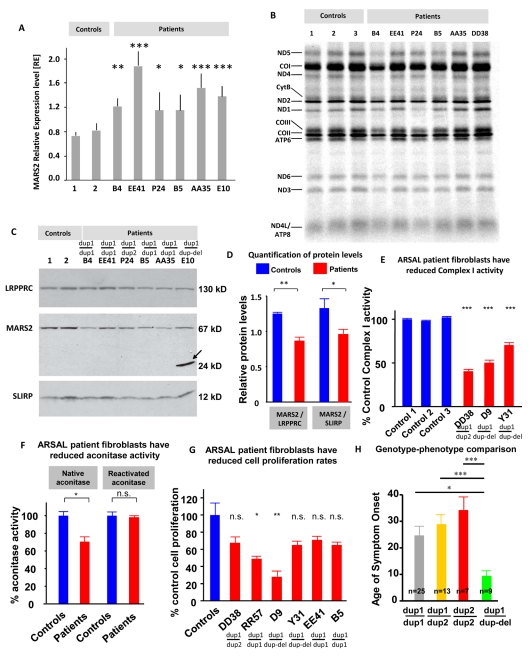
Figure 8. MARS2 mRNA expression, protein levels, mitochondrial protein translation, Complex I, aconitase activity, and cell proliferation.
(A) Quantification of MARS2 mRNA expression levels was performed on six ARSAL cases and two control lymphoblast cell lines. Relative expression levels were normalized to GAPDH levels. ARSAL patients expressed up to 3× higher MARS2 mRNA levels compared to controls. (B) Mitochondrial protein synthesis was measured in lymphoblasts and fibroblasts from three controls and six ARSAL patients by pulse-labeling mitochondrial translation products with 35S-methionine for 1 h in the presence of emetine, followed by electrophoresis on a 15%–20% linear-gradient polyacrylamide gel. The 13 mitochondrial products are identified at the left of the figure. A generalized mitochondrial translation deficiency is observed in three of the six ARSAL patients tested. ANOVA analysis revealed significance for three of the patient's mitochondrial translation levels: Ctrl 1-B4: **, Ctrl 1-B5: n.s., Ctrl 1-P24: n.s., Ctrl 2-B4: ***, Ctrl 2-B5: n.s., Ctrl 2-P24: *, Ctrl 3-B4: ***, Ctrl 3-B5: *, Ctrl 3-P24: ***. (C) Immunoblotting analysis was performed with antibodies against the proteins indicated at the left of the panel. MARS2 was visualized using a polyclonal antibody. For case E10 carrying the heterozygous deletion (c.681Δ268bpfx236X), the truncated product is detected at the estimated size of 24 kDa (arrow); ARSAL patients (B4, EE41, P24, B5, AA35, and E10) show decreased levels of MARS2 protein at the estimated normal size of MARS2 (67 kDa). The 130 kDa LRPPRC and the 12 kDa SLIRP were used as loading controls. (D) Each patient's MARS2 protein-level intensity from the Western Blot shown in (C) was quantified using ImageJ and divided by the protein-level intensities of LRRPRC and SLIRP. The results were then graphed for the controls and the patients, respectively. (E) Respiratory chain activity for Complex I was measured from patient fibroblast-derived disrupted mitochondria. Mutant mitochondria exhibit deficiency of complex I. Data are expressed as percentage control activity (mean ± s.e.m.). (F) Quantification of native and reactivated aconitase activity for ARSAL patient and control immortalized fibroblasts. Three controls and 6 ARSAL patients were used for the analysis. (G) Quantification of the proliferation rate for the same above-mentioned fibroblasts. (H) Graph showing the average age of onset for the three different genotypes involved.

