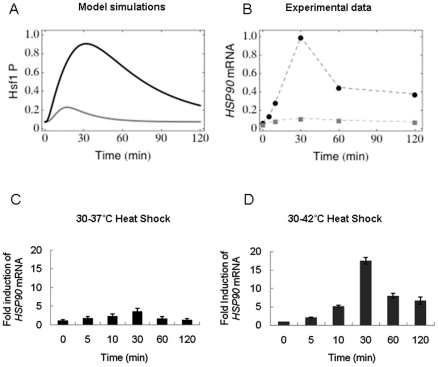
Figure 3. Dynamic changes in HSP90 mRNA during the heat shock response.
Comparison of model simulations and experimental evidence representing HSP90 mRNA levels during thermal upshifts. (A) Model simulations of the dynamic changes in HSP90 mRNA levels following heat shock: grey line 30°C–37°C, black line: 30°C–42°C. (B) Graphical illustration of experimentally determined HSP90 mRNA levels following heat shock generated in experiments such as those shown in (C) and (D): grey line 30°C–37°C, black line: 30°C–42°C. (C) qRT-PCR quantification of HSP90 mRNA levels relative to the internal ACT1 mRNA control were analysed during a 30°C–37°C heat shock. (D) qRT-PCR quantification of HSP90 mRNA levels relative to the internal ACT1 mRNA control were analysed during a 30°C–42°C heat shock.

