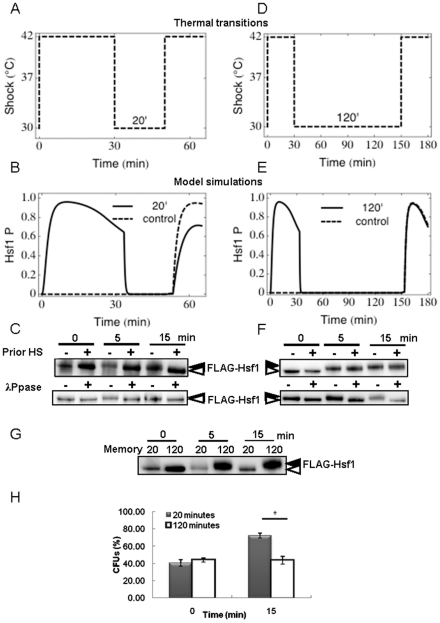
Figure 5. Impact of sequential heat shocks.
The model was used to simulate sequential 30 minute heat shocks of 30°C–42°C separated either by 20 or 120 minutes. Outcomes were then tested experimentally by determining Hsf1 phosphorylation levels. (A) Representations of the thermal transitions with the 20 minute recovery period. (B) Model simulations of Hsf1 phosphorylation for a 20 minute recovery period between heat shocks: solid black line simulates Hsf1 phosphorylation in cells that have seen a prior heat shock, dashed black line simulates Hsf1 phosphorylation in control cells that have had no prior heat shock. (C) These predictions were tested experimentally by moving exponentially growing cells from 30°C to 42°C for 30 minutes. Cells were then placed back at 30°C for 20 minutes before they received a second heat shock at 42°C. Control cells only received the second heat shock with no prior heat shock. Proteins were extracted and subjected to western blotting to measure Hsf1 phosphorylation (upper panel). The lower panel shows lambda phosphatase controls (λ Ppase) that confirm the Hsf1 phosphorylation states shown in the upper panel. (D) Representations of the thermal transition with a 120 minute recovery period between heat shocks. (E) Model simulation of Hsf1 phosphorylation for a 120 minute recovery period between heat shocks: solid black line, predicted Hsf1 phosphorylation in cells that have seen a prior heat shock; dashed black line, predicted Hsf1 phosphorylation in control cells that have had no prior heat shock. (F) These predictions were tested experimentally by moving exponentially growing cells from 30°C to 42°C for 30 minutes. Cells were then placed back at 30°C for 120 minutes before they received a second heat shock at 42°C. Control cells only received the second heat shock with no prior heat shock. Protein extracts were subjected to western blotting to measure Hsf1 phosphorylation (upper panel). The lower panel includes lambda phosphatase controls (λ Ppase) that confirm the phosphorylation status of samples from the upper panel. (G) Further controls involving direct comparison of 20 and 120 minute memory samples to confirm the differential Hsf1 phosphorylation in these samples, and hence the loss of molecular memory after 120 minutes. (H) The loss of molecular memory is reflected in reduced cellular resistance to the second heat shock. Cell viabilities (CFUs) were measured 0 and 15 minutes after the imposition of the second 30°C–42°C heat shock: grey bars, cells that received a 20 minute interval between heat shocks; grey bars, cells that received a 120 minute interval between heat shocks (* p<0.05, students t-test). Data reflect the outcomes for at least two independent replicate experiments.

