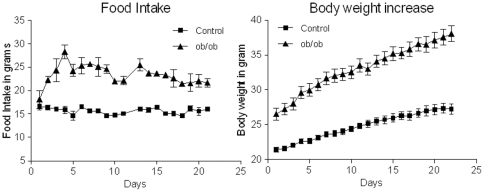
Figure 2. Body weight and food intake in mouse model of obesity.
A) Repeated measures ANOVA showed significant increase in body weight in ob/ob mice; F(1;14) = 66.421;p<0.001. B) Food intake was significantly higher in ob/ob mice compared to lean control as analysed using repeated measures ANOVA; F(1;2) = 52.333;p<0.001; n = 8 per genotype.

