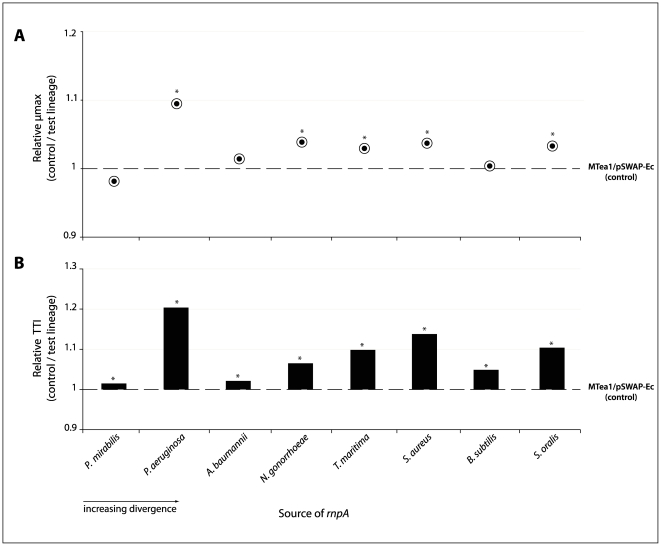
Figure 2. Effect of heterolog divergence on growth parameters of test lineages.
A) Relative maximum specific growth rates (normalized to MTea1/pSWAP-Ec) for each test lineage. µmax is defined as the maximum growth rate in the Richards growth model [23]. B) Differences in the time to inflection of each test lineage relative to MTea1/pSWAP-Ec. The time to inflection (TTI) is defined as the length of time required to reach µmax. Values for the control lineage are arbitrarily set to 1. Asterisks indicate p values <0.001.

