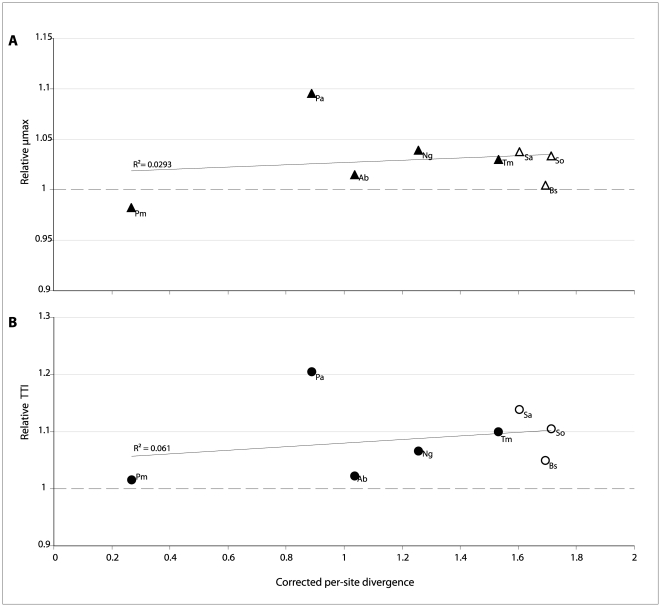
Figure 3. Correlation between rnpA divergence and growth parameters in test lineages.
Panels A) and B) show the relationship between the previously defined growth parameters (µmax and TTI, respectively) and the corrected per-site divergence (number of amino-acid substitutions per amino-acid site using JTT substitution model as implemented in MEGA5.0 [51]). The dotted line represents growth parameter values for the E. coli control lineage, arbitrarily set to 1. Symbols are labeled to indicate the source organism of the rnpA heterolog present in pSWAP: Ab, A. baumannii; Bs, B. subtilis; Ec, E. coli; Pa, P. aeruginosa; Pm, P. mirabilis; Ng, N. gonorrhoeae; Sa, S. aureus; So, S. oralis; Tm, T. maritima. Solid line represents best-fit linear regression.

