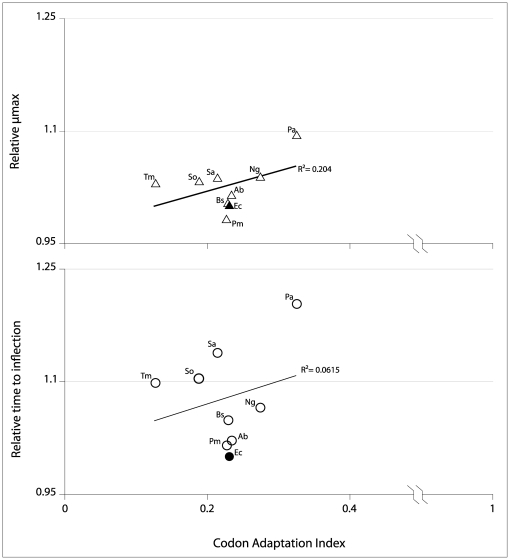
Figure 4. Correlation between growth parameters of test lineages and the Codon Adaptation Index (CAI).
Solid symbols represent the values for E. coli; open symbols represent heterologous rnpA CAI and growth parameters of the test lineages, labeled as follows: Ab, A. baumannii; Bs, B. subtilis; Ec, E. coli; Pa, P. aeruginosa; Pm, P. mirabilis; Ng, N. gonorrhoeae; Sa, S. aureus; So, S. oralis; Tm, T. maritima.

