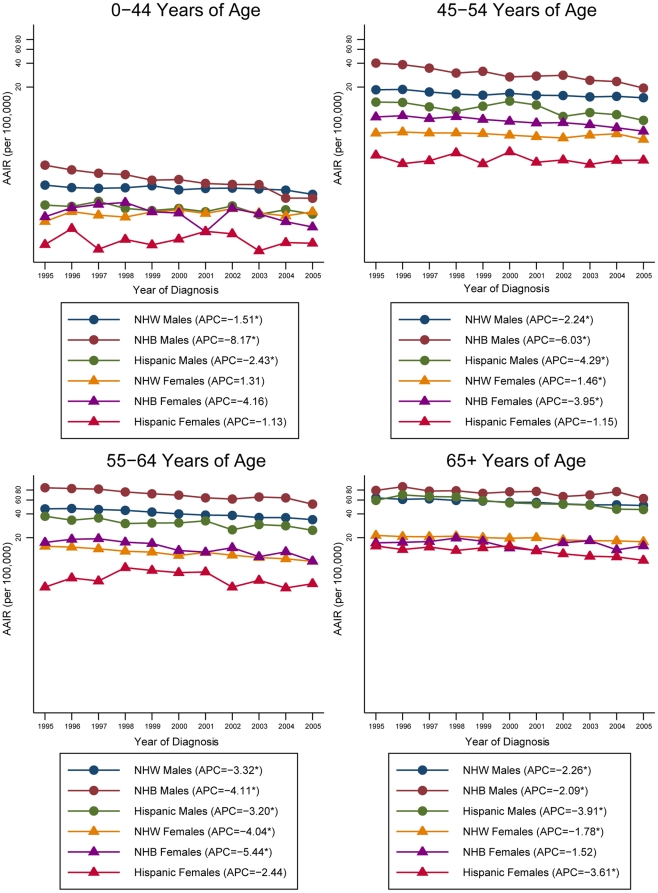
Figure 4. Annual percent change for age-adjusted HNC incidence rates by age, sex and race/ethnicity for Non HPV-associated sites, 1995–2005.
AAIR: age-adjusted incidence rate; HNC: head and neck cancer; HPV: human papillomavirus; APC: annual percent change; NHW: Non-Hispanic Whites; NHB: Non-Hispanic Blacks. *Rates are significantly different from zero (p<0.05). Rates are per 100,000 and age-adjusted to the 2000 US Standard Population (19 age groups – Census P25-1130). Annual percent change was calculated using the least squares method. Only registries contributing data to the entire 1995–2005 period were used in the analysis.

