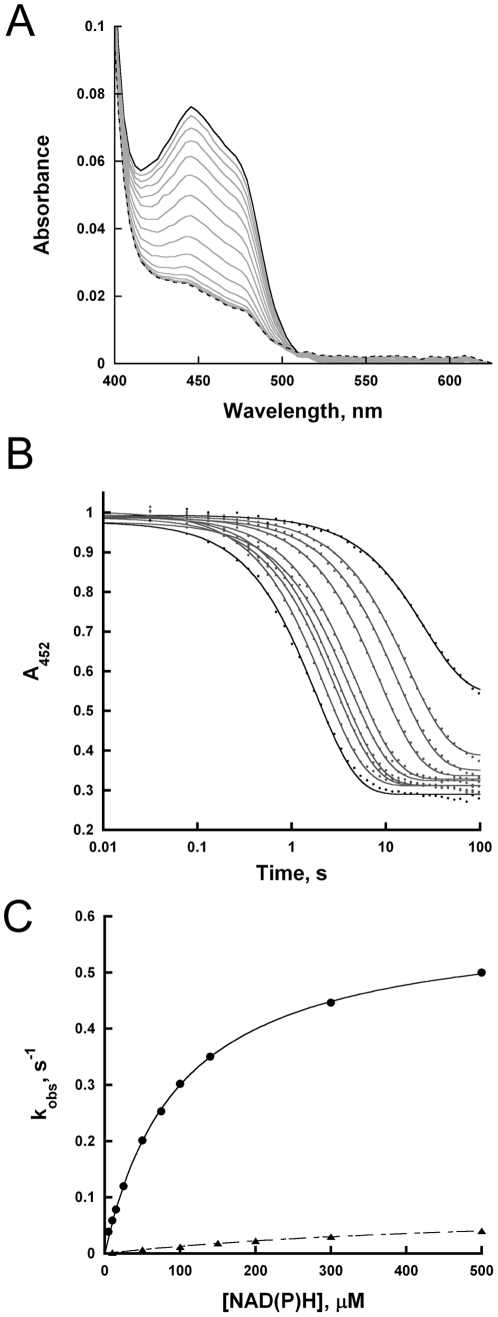
Figure 4. Anaerobic reduction of TcUGM with NAD(P)H.
Reduction was monitored using the stopped flow spectrophotometer at 15°C. The data was collected from 2 ms to 100 s on a logarithmic timescale. A) Changes in the spectra of oxidized TcUGM after mixing with 0.5 mM NADPH over 23 s. B) Traces of the flavin reduction at various concentrations of NADPH. The data were fit to a single exponential decay equation. C) The kobs values were plotted as a function NADPH (•) and NADH (▴) concentrations and fitted using the equation 2.

