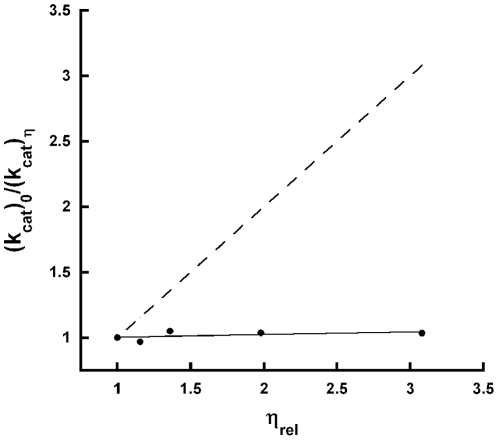
Figure 6. Viscosity effect on kcat.
The effect of viscosity was determined by measuring the activity of TcUGM as a function of increasing concentrations of glycerol. The data was fit to a linear equation; the dashed line depicts the results of a diffusion controlled reaction. This line has a slope of 1.

