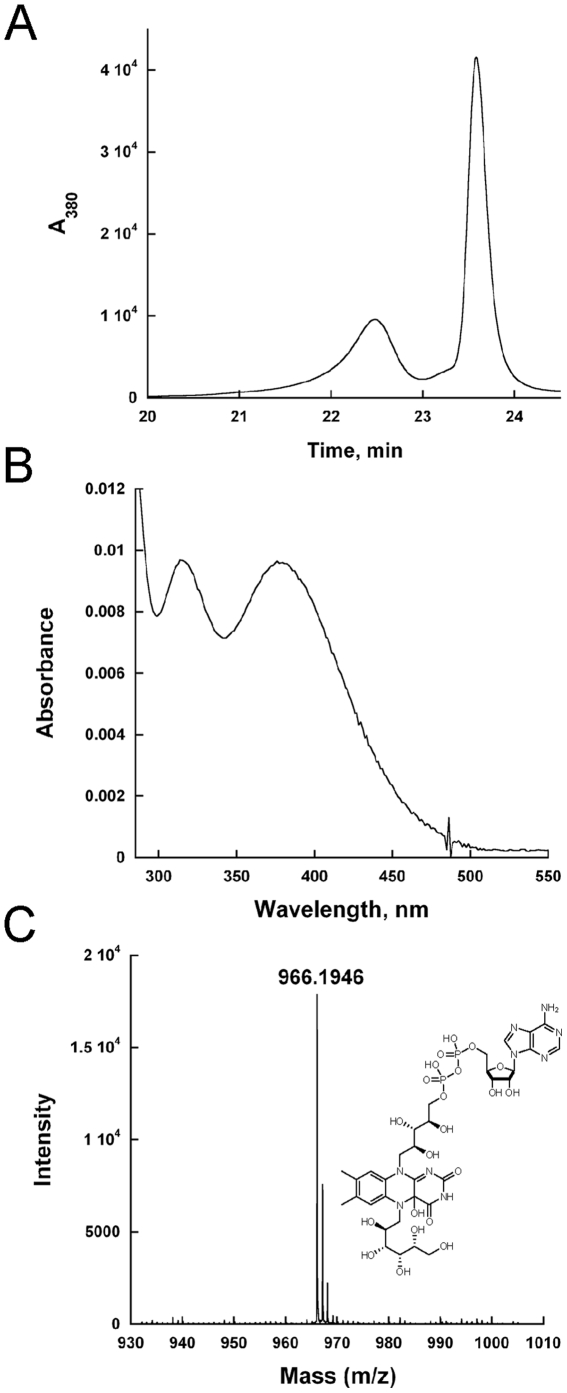
Figure 8. Trapping of a covalent flavin intermediate.
A) HPLC traces of the flavin sugar adduct from free FAD. The peak eluding at 22.5 min is the adduct, while the second peak at 23.6 min is FAD. B) Spectrum of the C4a- hydroxyflavin-galactose adduct. C) High resolution mass spectrometry results of the peak containing the flavin adduct. The inset shows the structure of the adduct with a hydroxyl group at the flavin C4a-position.

