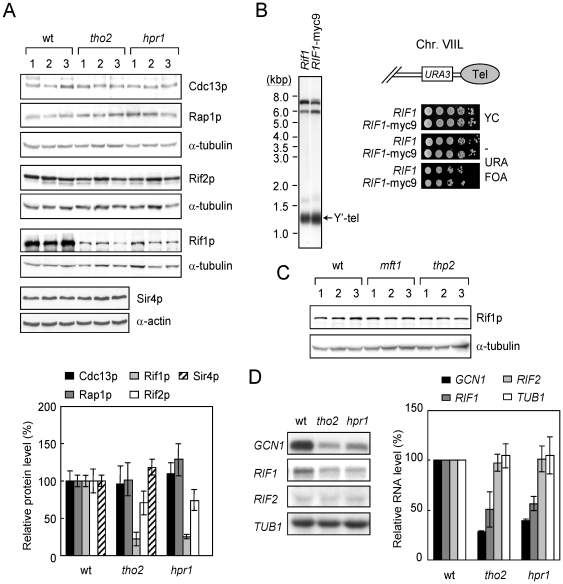
Figure 2. tho2 and hpr1 selectively decrease the expression level of Rif1p.
(A) The Rif1p protein level is decreased in tho2 and hpr1 cells. Total yeast proteins from wild-type, tho2 or hpr1 yeast cells were precipitated with TCA, separated on an 8% SDS-polyacrylamide gel, and analyzed by immunoblotting using antibodies against Rap1p, Cdc13p, α-tubulin, α-actin, Myc (for myc9-tagged Rif1p and Rif2p), or TAP (for TAP-tagged Sir4p) (top panel). The percentages of protein expression relative to the wild-type cells are quantified (bottom panel). The bars were standard deviations determined using data from three different colonies of the indicated yeast strain. (B) The myc9-epitope tagging does not affect the effect of Rif1p on telomere length and telomere silencing. Telomere length of wild-type RIF1 or RIF1-myc9 cells were determined by Southern blotting using the Y′ element probe (left panel). Telomere silencing effects were determined in RIF1 or RIF1-myc9 cells. Yeast cells in 10-fold serial dilutions were spotted on YC, YC lacking uracil, or plates containing 5-FOA (right panel). (C) The Rif1p protein level is not affected in mft1 and thp2 cells. The Rif1p level is analyzed in mft1 and thp2 cells using immunoblotting analysis. (D) tho2 and hpr1 reduced the RIF1 RNA levels. The RNA transcripts of GCN1, RIF1, RIF2, and TUB1 were analyzed using Northern blotting assays (left panel). The expression levels of the indicated RNA transcripts were quantified and displayed as the percentages relative to the expression level in wild-type cells (right panel). The error bars were standard deviations calculated using data from three different colonies of the indicated yeast strain.

