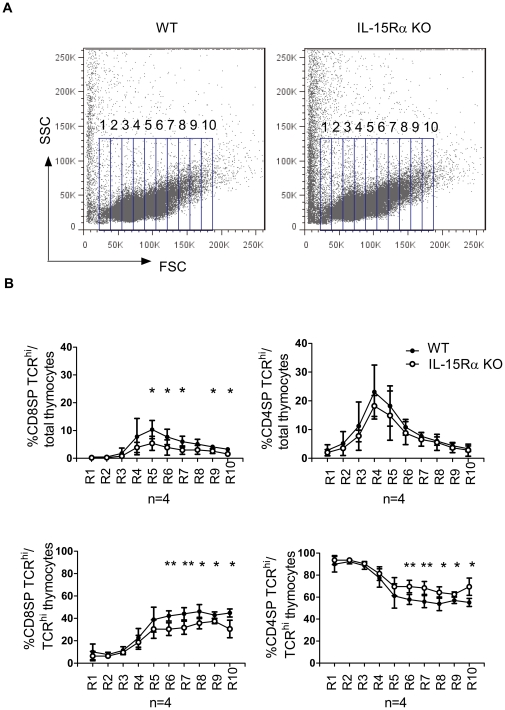
Figure 3. Comparison of large SP TCRhi thymocytes between WT and IL-15Rα KO mice.
Total thymocytes were isolated from WT and IL-15Rα KO mice (n = 4) and stained for CD4, CD8, and TCR. (A) Cells were gated into 10 sub-regions (R1 to R10) on the basis of FSC. (B) The frequency of CD8SP TCRhi thymocytes in each specified regions is displayed as percentages of total thymocytes (upper panels) or percentages of total SP TCRhi thymocytes (lower panels). Data are means ± SD values. **p<0.005 *p<0.05 Single-classification ANOVA.

