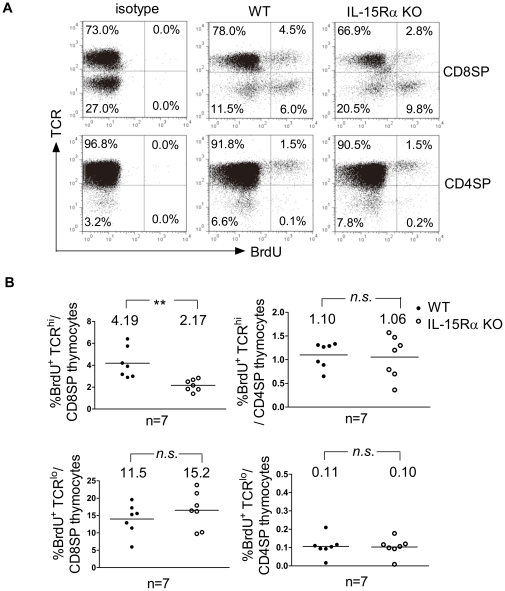
Figure 4. In vivo proliferation of CD8SP TCRhi and CD4SP TCRhi thymocytes analyzed by BrdU incorporation.
WT and IL-15Rα KO mice (n = 7) were injected i.p. with BrdU. Total thymocytes were isolated 1 hr later, and the degrees of BrdU incorporation by CD4SP TCRhi and CD8SP TCRhi cells was determined. (A) Upper panel; The BrdU incorporation of IL-15Rα KO CD8SP TCRhi cells (3.2×10⁴±1.1×10³ cells) was compared with that of WT CD8SP TCRhi cells (9.4×10⁴±3.1×10³ cells). Lower panel; The percentages of WT (1.6×10⁵±1.0×10⁵ cells) and IL-15Rα KO CD4SP TCRhi (1.5×10⁵±0.7×10⁵ cells) thymocytes that incorporate BrdU. (B) Values of each experimental group are averaged and the means are indicated by horizontal lines. Data are presented as means ± SD. **p<0.005; n.s., not significant. Single-classification ANOVA.

