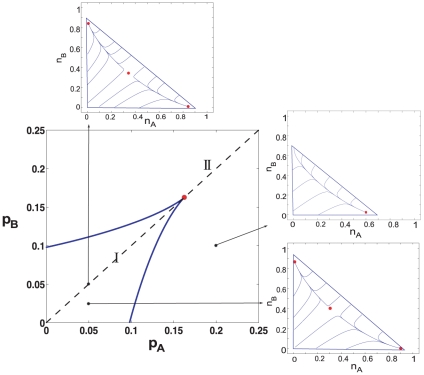
Figure 1. Mean-field picture in parameter space.
The phase diagram obtained by integrating the mean-field Eqs. (1). The two lines indicate saddle-node bifurcation lines which form the boundary between two regions with markedly different behavior in phase space. For any values of parameters within the beak, denoted as region I, the system has two stable fixed points separated by a saddle point. Outside of the beak, in region II, the system has a single stable fixed point. The saddle-node bifurcation lines meet tangentially and terminate at a cusp bifurcation point.

