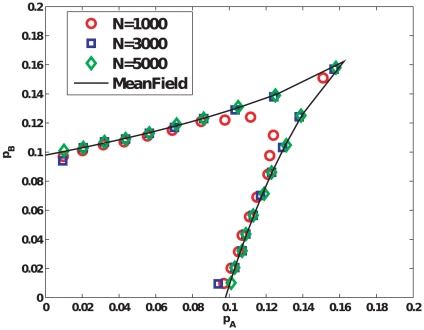
Figure 3. Picture in parameter space for a complete graph obtained from analytical and simulation results.
The bifurcation lines and the cusp point in parameter space were obtained analytically from the mean field equations and are compared with those found using simulations for finite-sized complete graphs. Analytical and simulation curves show excellent agreement as  increases. The location of the transition occurring across the bifurcation curve was obtained using the Binder cumulant
  (Fig. 2(d)), while the location of the cusp point was obtained by using variance of
  (Fig. 2(e)). For both analytical and simulation results, the bifurcation curves are obtained by identifying the critical points that lie on linear trajectories in parameter size described by
  . This process is carried out for different values of
  between
  and
and  at intervals of
  , and for each value of
  ,
,  is varied at a resolution of
  . In simulations, for each such combination of
  obtained, we perform averages over
  realizations of the social influence dynamics, for each of two initial conditions,
  , and
, and  , with
  for each case.

