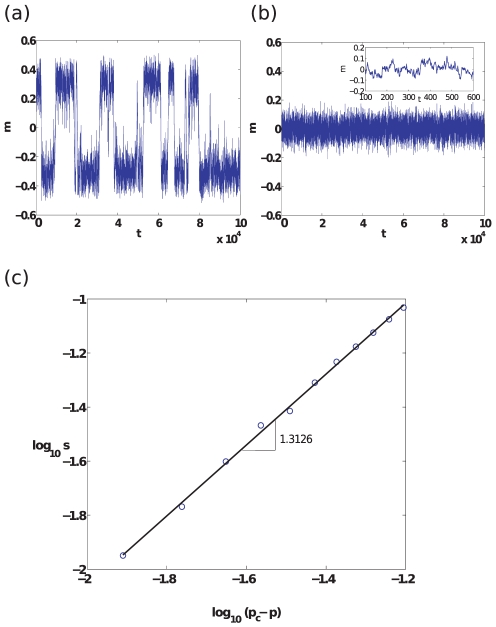
Figure 4. Evolution of order parameter  and the exponential growth in switching time as a function of distance from the second-order critical point.
(a) Switches in the value of  as a function of time
  for a sample evolution (with initial transient removed) of the system when
  (
( ). This reflects the system repeatedly switching between the
  -dominant steady-state (
 ) and the
  -dominant steady-state (
 ). (b) Sample evolution of the system (with initial transient removed) for
  (
( ). The system fluctuates randomly about the only existing steady-state in which densities of
  and
and  nodes are equal. (c) The dependence of
  in the exponential scaling
  when
when  (
( ) as a function of
  , obtained using the eikonal approximation (see SI: Section 4).

