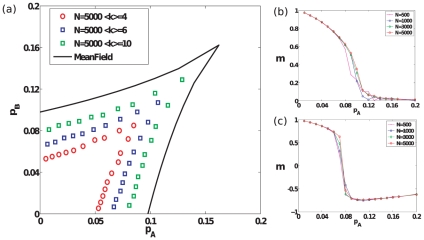
Figure 5. Results for Erdös-Rényi random graphs.
(a) The bifurcation lines and cusp point in parameter space obtained through simulations of Erdös-Rényi random graphs of size  with different average degrees. The mean-field analytical curve is shown for comparison. For simulation results, the bifurcation curves are obtained by identifying the critical points that lie on linear trajectories described by
  in parameter space. This process is carried out for different values of
  between
  and
and  at intervals of
  , and for each value of
  ,
,  is varied at a resolution of
  . For each such combination of
  obtained, we perform averages for quantities of interest over
  realizations of networks (with a single realization of the social influence dynamics per network), for each of two initial conditions,
  and
and  with
with  in each case. (b)–(c) Steady-state magnetization for ER graphs with
  and different sizes
  , as parameter pair values are varied successively along slope
  and slope
  lines in parameter space respectively.

