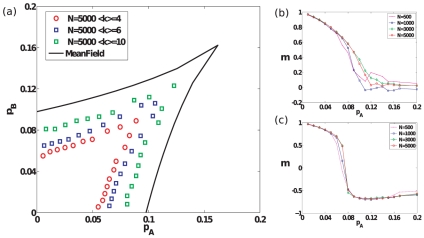
Figure 6. Results for Barabási-Albert networks.
(a) The bifurcation lines and cusp point in parameter space obtained through simulations of Barabási-Albert networks of size  with different average degrees. For simulation results, the bifurcation curves are obtained by a similar method as described in the legend of Fig. 5(a). (b)–(c) Steady-state magnetization for BA networks with
  and different sizes
  , as parameter pair values are varied successively along slope
  and slope
  lines in parameter space respectively.

