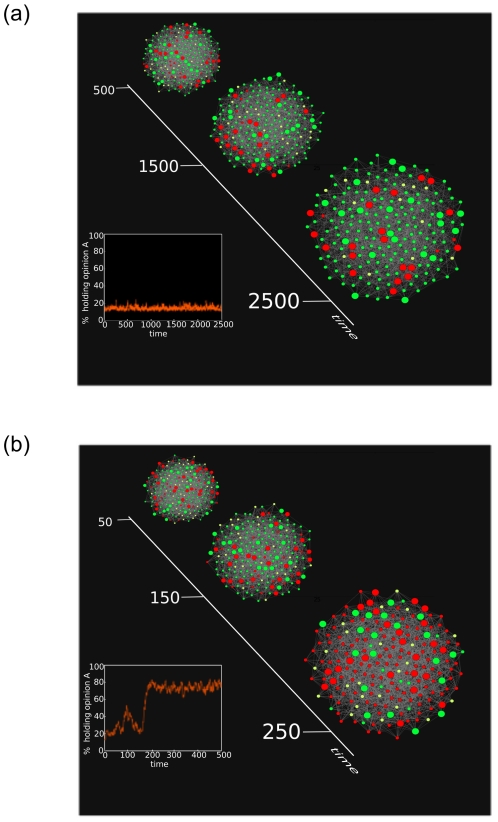
Figure 7. Visualization of opinion evolutions.
The evolution of opinions on an ER random graph with  and
and  for two
  pairs. In each case
  and
and  . Nodes holding opinion
  are depicted in red, while nodes holding opinion
  are shown in green. Nodes with larger diameters are committed nodes. Top: The case
  for which the system is in region I in parameter space (following the terminology of Fig. 1, and the system is trapped in a
  -dominant steady-state. Even after
  time steps, the system continues to remain trapped in this state (inset) with
  . Bottom: The case
  and
and  for which the system is in the region II, and undergoes an abrupt transition (inset) to the
  -dominant state within
  time steps.

