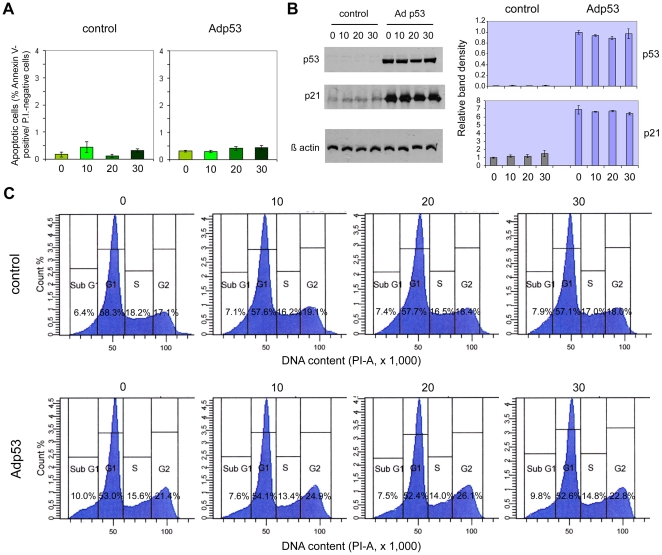
Figure 5. Effects of wt p53 overexpression and cadmium treatment in PC-3 cells.
A: early apoptosis detection. The frequencies of apoptotic cells were determined in both Adp53-transduced and control PC-3 cells by FITC-conjugated Annexin-V/PI and FACS analysis after 24-h treatment with different CdCl2 concentrations (0,10, 20 and 30 µM). Histograms represent mean percentages ± SEM of Annexin-V positive/PI-negative cells (n = 3). B: western blot analysis. The levels of total p53 and p21 proteins were examined after Adp53-mediated overexpression of wild type p53, followed by 24-h treatment with different CdCl2 concentrations (0,10,20 and 30 µM). Histograms represent relative band densities (mean ± SEM, n = 3), as determined by densitometry, using β-actin as the loading control for standardization. C: cell cycle distribution. FACS analysis of Adp53-transduced and control PC-3 cells was performed after 24-h treatment with different CdCl2 concentrations (0, 10, 20 and 30 µM).

