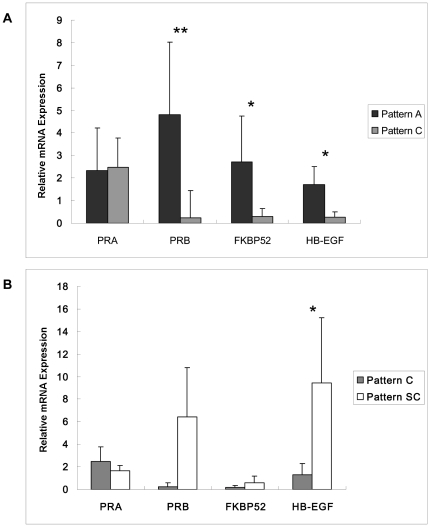
Figure 3. The mRNA expression pattern of PRA, PRB, FKBP52, and HB-EGF.
The level of PRA, PRB, FKBP52, and HB-EGF mRNA was measured by real-time RT PCR. The values were normalized to GAPDH. A, the mRNA expression was compared between the patients with endometrium of Pattern A and Pattern C by Heteroscedastic T-test. B, the mRNA expression was compared between the same patient with endometrium of Pattern C and Pattern SC by paired T test. *, P<0.05; **, P<0.01.

