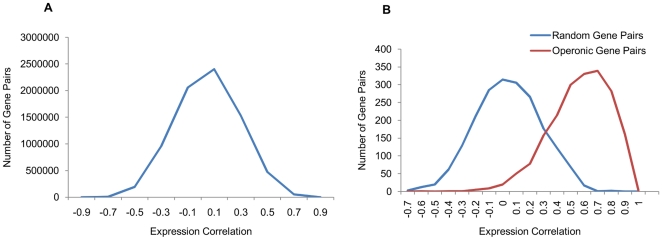
Figure 1. Pearson correlation coefficient between expression values of pairs of genes.
A) The genome-wide gene expression correlations of all the gene pairs and B) expression correlation between operonic gene pairs and randomly paired non-operonic gene pairs. As anticipated, it is evident that the genes on operons exhibit higher correlation in their expression compared to the non-operonic gene pairs.

