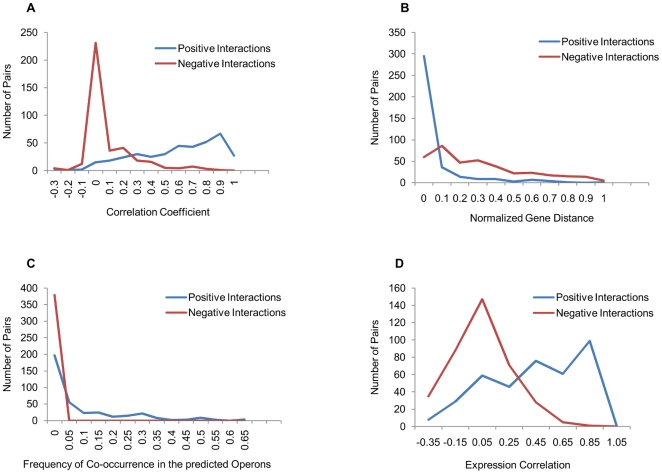
Figure 2. Plots indicating the distinctive behavior of the positive and negative protein interaction pairs with respect to genome context methods and gene expression correlations.
All the four features show statistically significant and distinct distribution for the positive and negative pairs. A) Phylogenetic Profile, B) Gene Distance, C) Operonic Method and D) Expression Correlation.

