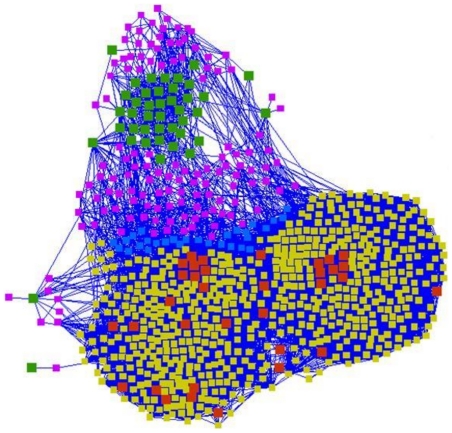
Figure 7. Schematic representation of the up and down-regulated modules.
Node color represents the class as follows: Green – Upregulated proteins; Red – Downregulated proteins; Purple – First neighbors of the upregulated proteins; Yellow – First neighbors of the downregulated proteins; Blue – Proteins interacting with both upregulated and downregulated proteins.

