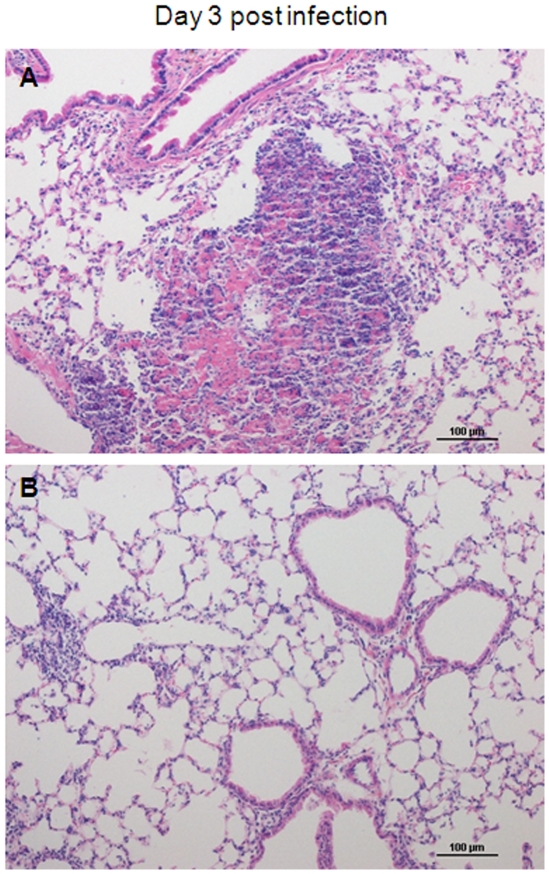
Figure 3. Histological analysis.
Representative images from Hematoxylin and Eosin stained mouse lungs for control (A) and CpG treated (B) animals at day 3 post infection. At day 3 post infection, control animals show large nodular, confluent areas of alveolar inflammation with necrosis, whereas inflammation in CpG treated animals is sparse, peribronchial and perivascular in location, and without necrosis.

