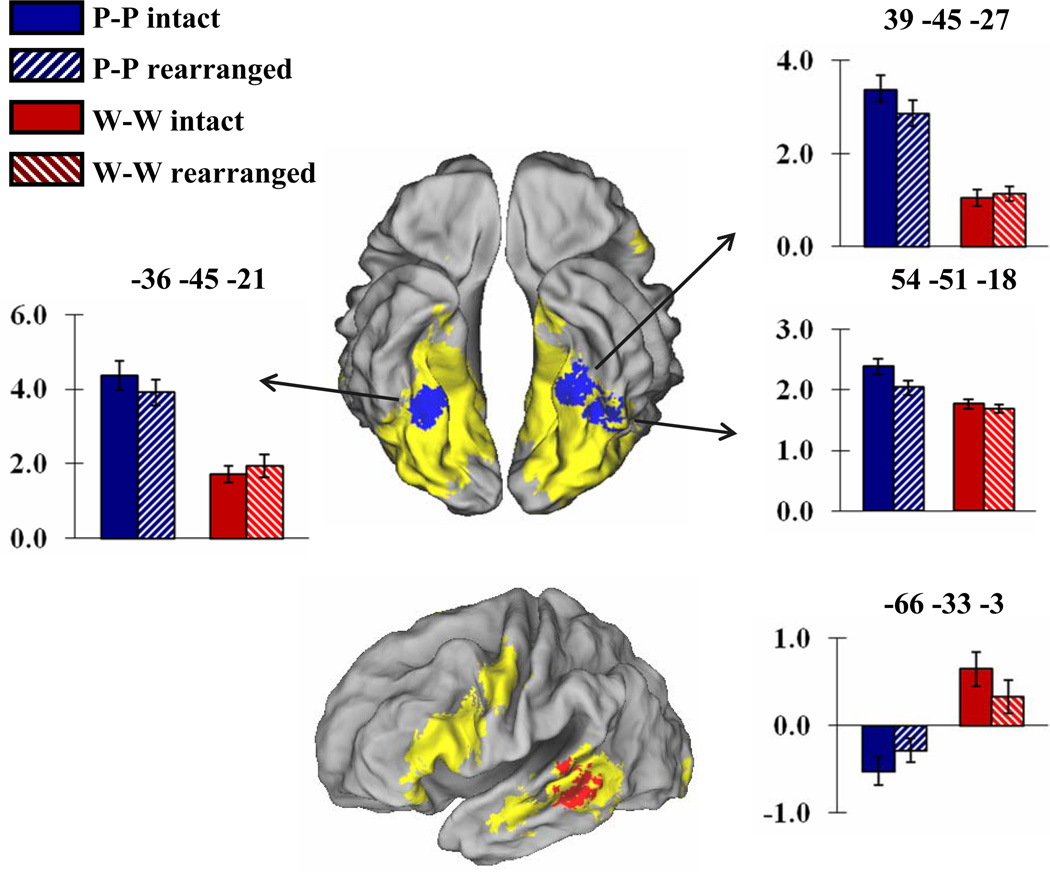
Figure 3.
Top: Regions where subsequent memory effects elicited by picture pairs exceed the effects elicited by word pairs (p < .01), and overlap with regions where picture-picture trials elicited more activity than word-word trials (p < .001, yellow). Area of overlap indicated in blue. Bar graphs illustrate mean and standard error of across subjects cluster-wise parameter estimates for study pairs correctly judged intact or incorrectly judged rearranged on the later memory test. Bottom: Corresponding data for word pairs (interaction thresholded at p < .05, area of overlap in red). Effects rendered on the PALS brain atlas.

