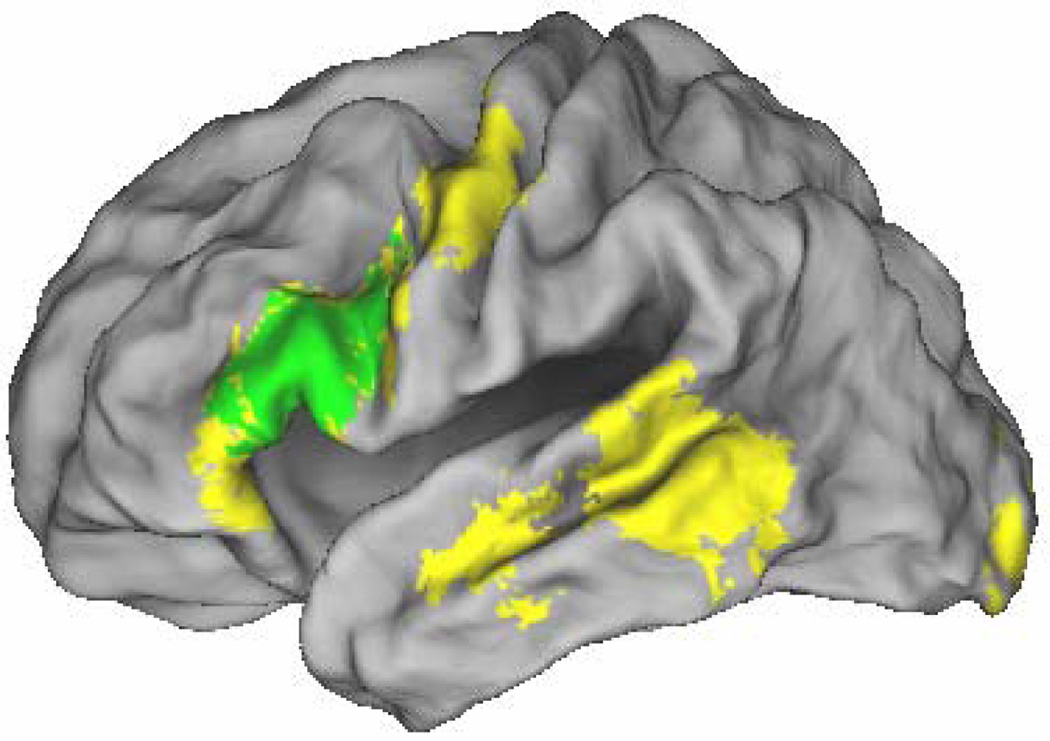
Figure 5.
Regions where subsequent associative memory effects elicited by word- and picture-pairs (thresholded at p < .01 in each case) overlap both with each other and with regions where activity is greater on word-word than picture-picture trials (thresholded at p < .001, yellow). Area of overlap shown in green. Effects are rendered onto the PALS brain atlas.

