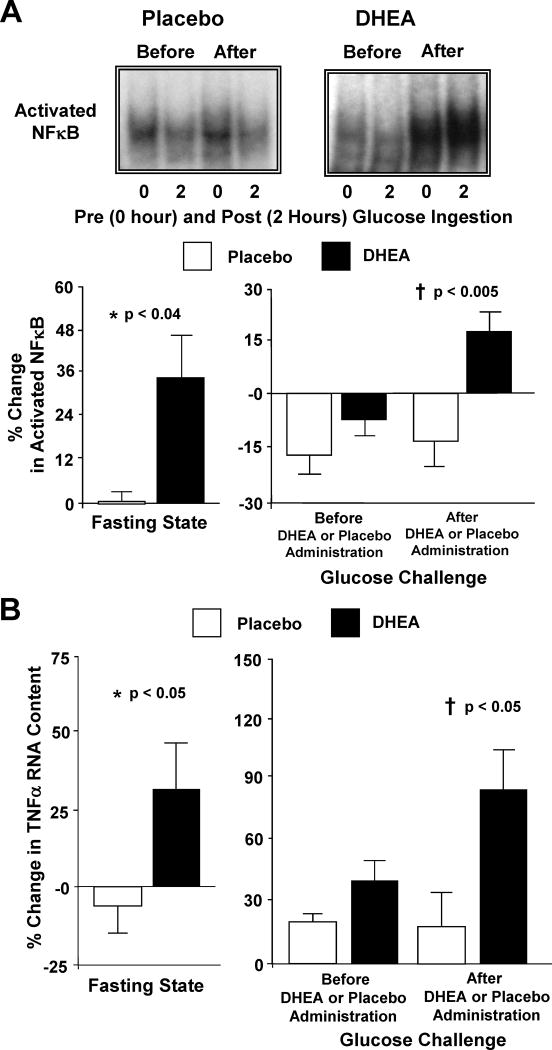
Figure 2.
(A) Representative EMSA bands from the two study groups showing the quantity of NFκB in nuclear extracts from mononuclear cells (MNC) in samples collected in the fasting state (0) and 2 hours post-glucose ingestion (2), before and after treatment with DHEA or placebo. Densitometric quantitative analysis comparing the change from baseline (%) in MNC-derived activated NFκB between the two study groups for fasting samples before and after (before versus after, 0) DHEA or placebo administration (left panel); and for fasting and 2 hour post-glucose ingestion samples for each OGTT (before, 0 versus 2; after, 0 versus 2) as a measure of the response to glucose challenge before and after DHEA or placebo administration (right panel). After DHEA administration, the % change in activated NFκB was significantly greater compared to placebo in the fasting state (*, P<0.04), and in response to glucose ingestion (†, P<0.005). (B) Comparison between groups of the change from baseline (%) in TNFα mRNA content in MNC for fasting samples before and after (before versus after, 0) DHEA or placebo administration (left panel); and for fasting and 2 hour post-glucose ingestion samples for each OGTT (before, 0 versus 2; after, 0 versus 2) as a measure of the response to glucose challenge before and after DHEA or placebo administration (right panel). Values are normalized to 28S rRNA expression. After DHEA administration, the percent (%) change in TNFα mRNA transcripts significantly increased compared to placebo in the fasting state (*, P<0.05), and in response to glucose ingestion (†, P<0.05). Adapted from González et al. [43], with permission. Copyright The American Physiological Society, 2011.

