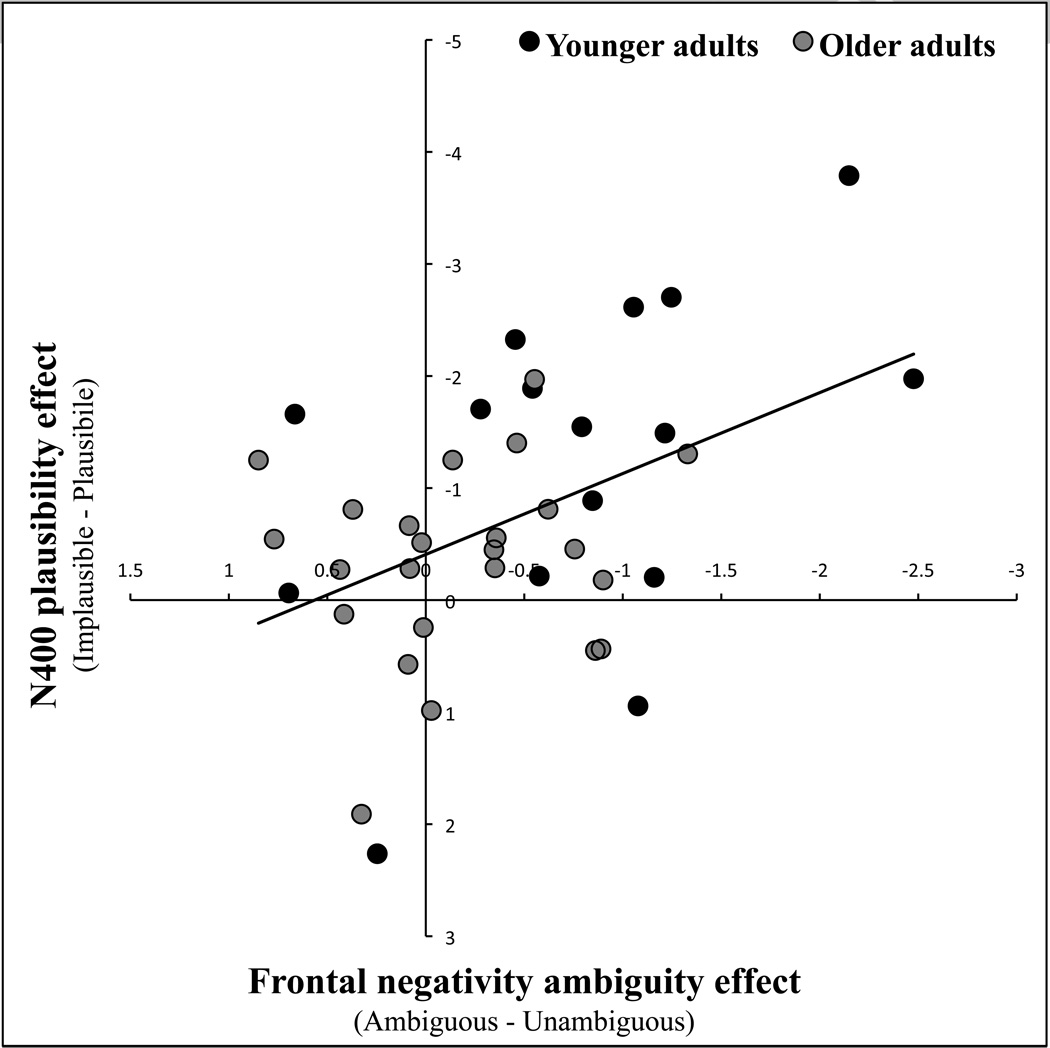
Figure 4.
The magnitude of each participant’s frontal negativity effect (250–1500 ms post onset of the NV-homographs) is plotted on the X axis against their subsequent N400 plausibility effect (300–600 ms post onset of the head nouns) on the Y axis (negativity is plotted up). The trend line plots the correlation between the two effects for the whole group. The scatter plot shows that larger frontal negativity effects (more negative values) are associated with larger N400 plausibility effects (more negative values), and thus that enhanced recruitment of the processes indexed by the frontal negativity leads to better downstream discrimination between contextually relevant and irrelevant meanings.

