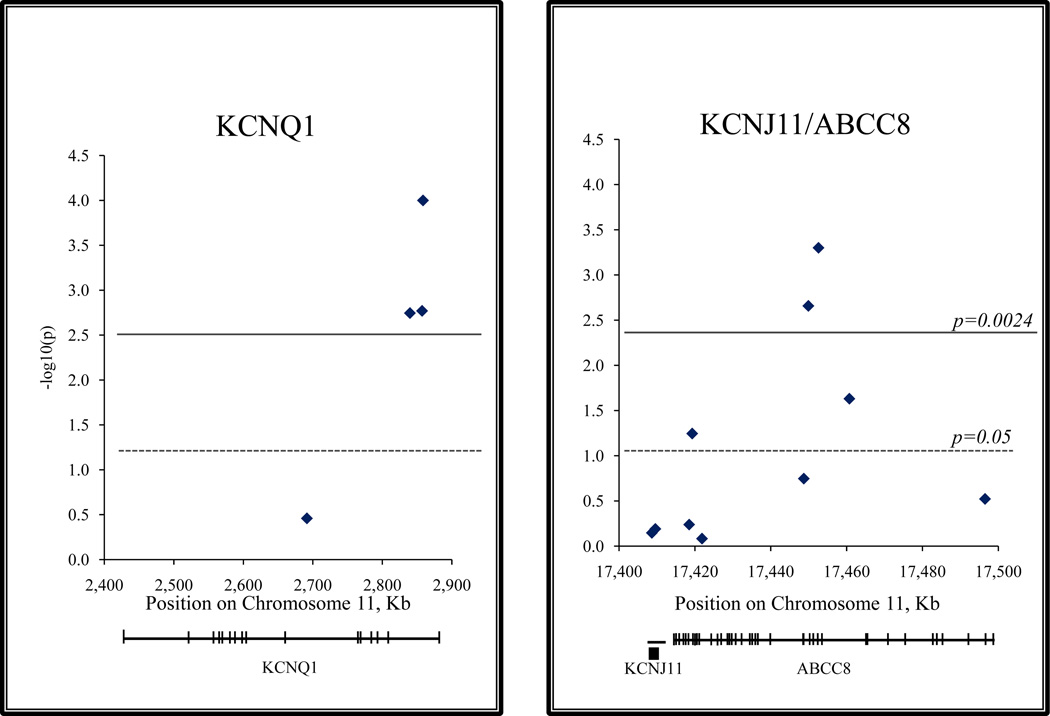
Figure.
Plots of T2D association signals in KCNQ1 (Panel A) and KCNJ11/ABCC8 (Panel B) genes detected in the Mongolian population. P-values for the association (in −log10 scale) are shown for each SNP as diamonds and plotted according to their location on chromosome 11. The strongest P-values for 3 SNPs in KCNQ1 (rs2237892, rs2237895, and rs2237897) and 2 SNPs in ABCC8 (rs1799858 and rs2074308) overcame the P-value threshold adjusted for multiple testing (P=0.0024).

