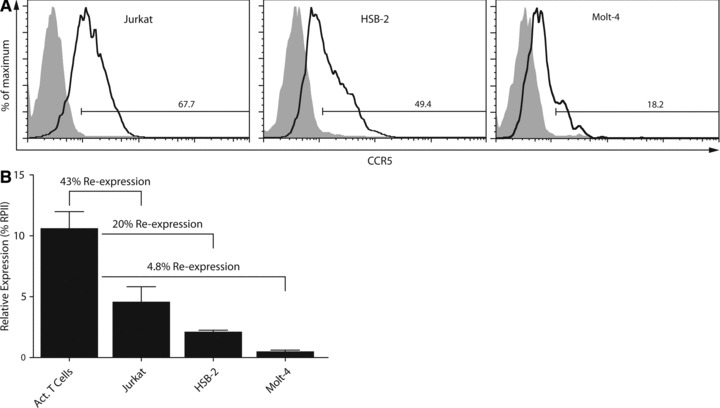
Fig 5.

(A) Restoration of CCR5 expression in Jurkat, HSB-2 and Molt-4 T leukaemia cell lines following exposure of cells to Zebularine, DZNep and MS275 determined by FACS analysis. Numbers indicate the percentage of CCR5 positive cells; filled histograms represent the non-treated cells and open histograms the treated cells. (B) Levels of CCR5 transcripts in treated Jurkat, HSB-2 and Molt-4 T leukaemia cells relative to CCR5 transcript levels in activated CD4+ T cells. The transcript level data of activated T cells are the same as shown in Figure 1B.
