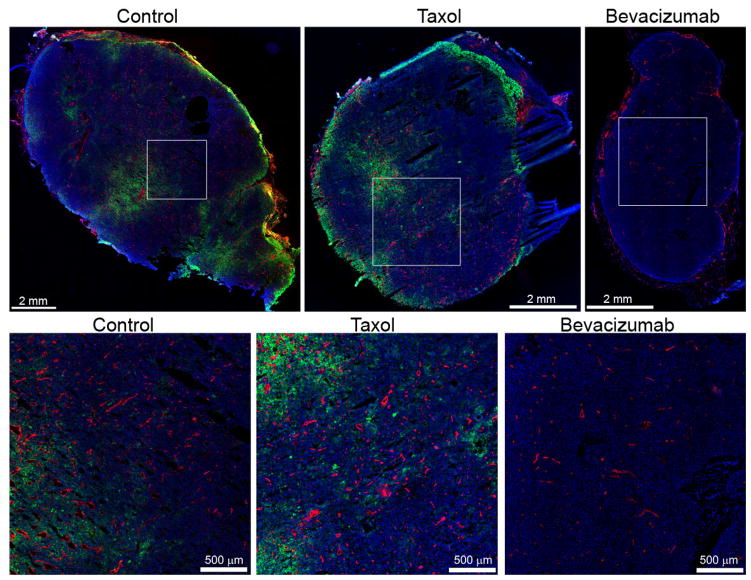
Fig. 4.
Summary of antibody distribution. B3 antibody (green), blood vessels (red), and nuclei (blue) are shown for each group as a whole tumor (top row) and with higher magnification (bottom row) to better appreciate the vascular density and antibody distribution. The B3 antibody channel was acquired and displayed with consistent levels, while the blood vessels and nuclei are displayed to maximize contrast.

