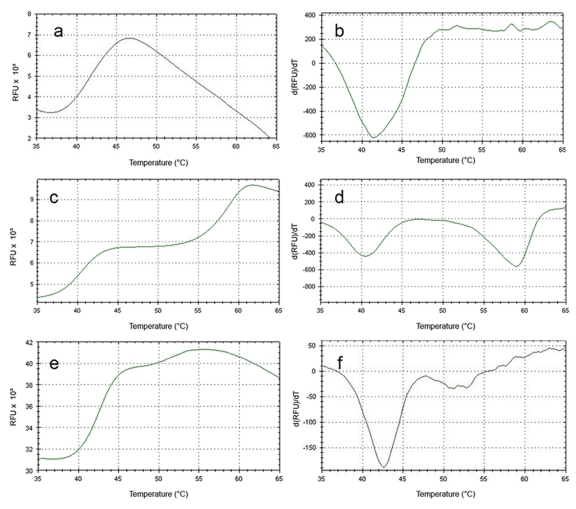
Figure 1. Using DSF to determine “melting” points of protein preparations.
Representative DSF output from the RT-PCR machine as matched sets of graphs displaying Relative Fluorescence Units (RFU) vs. temperature and the first derivative of RFU vs. temperature for ERα (a-b), ERα plus 200µM E2 (c-d) , and “empty vector” protein (e-f). Tm is calculated from the first derivative plots on the right.

