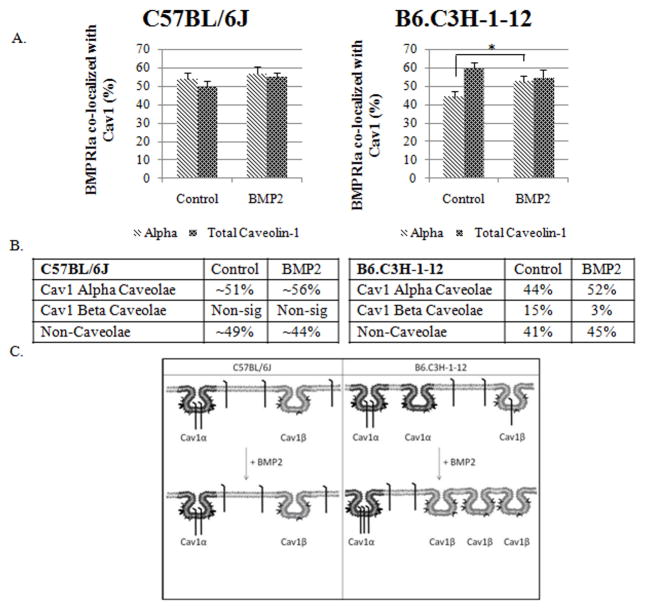
Figure 5. BMPRIa co-localized to a higher extent with caveolae in BMSCS isolated from B6.C3H-1-12 mice C57BL/6J.
BMSCs isolated from B6.C3H-1-12 and C57BL/6J mice were stimulated after 10 days in culture with BMP2 or not as indicated. Cells were fixed and stained for BMPRIa and Cav1 isoforms as indicated. High magnification images were collected and the percent of co-localization was calculated using Image Cross Correlation Spectroscopy. The top panel shows the graphs of ICCS data collected. In BMSCs of the C57BL/6J mice (left side), ~51% and ~56% of BMPRIa co-localized with labelled Cav1α and Cav1 total respectively. BMP2 stimulation led to a no significant change in co-localization. B6.C3H-1-12 (right side) mice showed 44% and 52% of BMPRIa co-localized with labelled Cav1α and Cav1 total. Stimulation with BMP2 led to a significance increase to 52% for labelled Cav1α. There was no significant change in the co-localization for labelled Cav1total. The middle panel shows tables of the calculated percentages of co-localization of BMPRIa with Cav1 α or Cav1 β enriched caveolae. Since the percentage of BMPRIa co-localized with labelled Cav1 α and Cav1 total were very similar (over lapping error bars) these numbers were averaged for the table. The lower panel shows the overall trends that were observed for BMPRIa co-localization with caveolae. * Indicates significance as detected by one tailed student t test (p<0.05).

