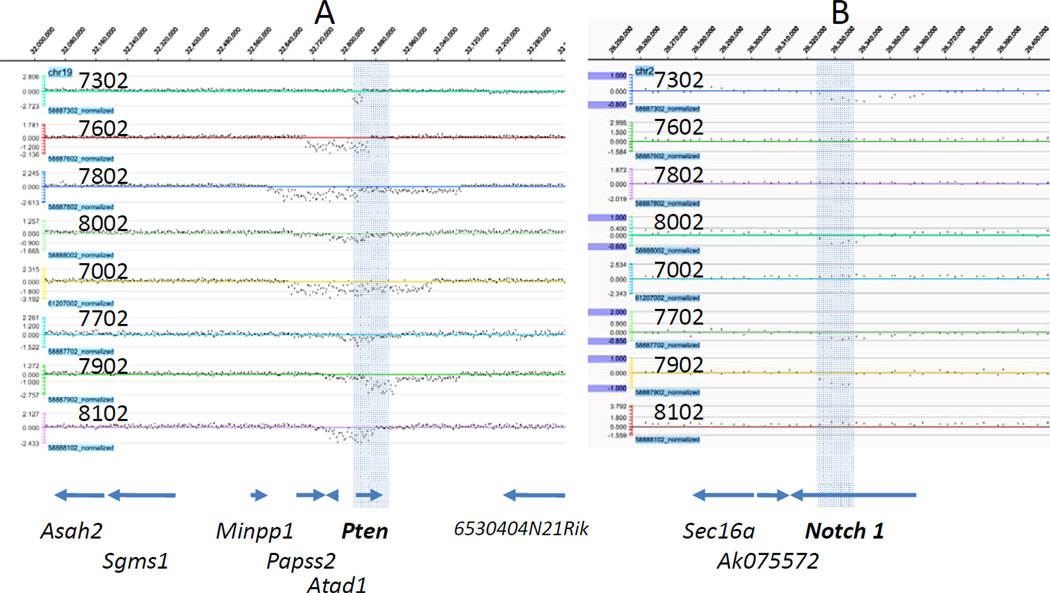
Figure 1.
aCGH for Pten and notch 1 containing regions of Chr19 and Chr2. Array CGH signal tracks (log2 ratios) for each of eight tumors as indicated by the tumor number are shown for the Pten region of Chr19 (Panel A) and the notch1 region of Chr2 (Panel B). In each case the positions of genes as defined by the UCSC genome browser gene track from the mm9 sequence build is aligned below the aCGH tracks. The shaded region in A denotes the location of Pten across all tracks and the shaded region in B denotes the location of exons 5–22 of notch1 across all tracks.

