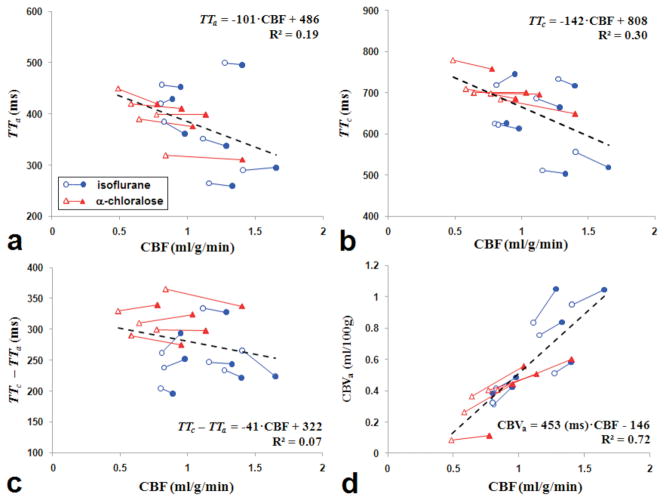
Figure 5.
Inter-animal relationships between physiological parameters obtained from Turbo-DASL data. CBF values measured with diffusion gradients (b = 50 s/mm2) at baseline (open symbols) and stimulation (filled symbols) in each animal (connected line) were plotted against corresponding TTa (a), TTc (b), TTc – TTa (c), and CBVa (d). Blue circles with blue lines and red triangles with red lines represent data measured from animals anesthetized with isoflurane and α-chloralose, respectively. The dash lines show a linear fit for all points on each plot. When CBVa is linearly correlated with CBF (d) with zero intercept, CBVa (ml/100g) = 320 (ms) · CBF (ml/100g/min).

