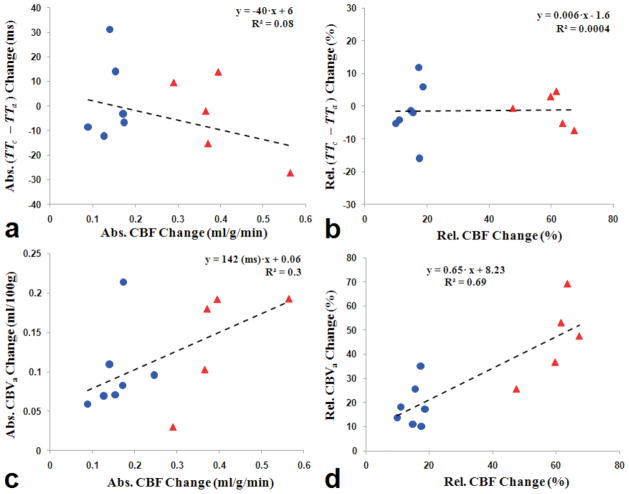
Figure 6.
Absolute (Abs.) and relative (Rel.) functional changes in CBF vs. TTc – TTa (a and b), and CBF vs. CBVa (c and d). CBF values were measured with diffusion gradients (b = 50 s/mm2). Blue circles and red triangles represent data obtained from isoflurane and α-chloralose anesthetized rats, respectively. The dash lines show a linear fit for all points on each plot. When functional CBF vs. CBVa relationship was obtained with zero intercept, ΔCBVa (ml/100g) = 244 (ms) · ΔCBF (ml/100g/min) and ΔCBVa (%) = 0.82 · ΔCBF (%).

