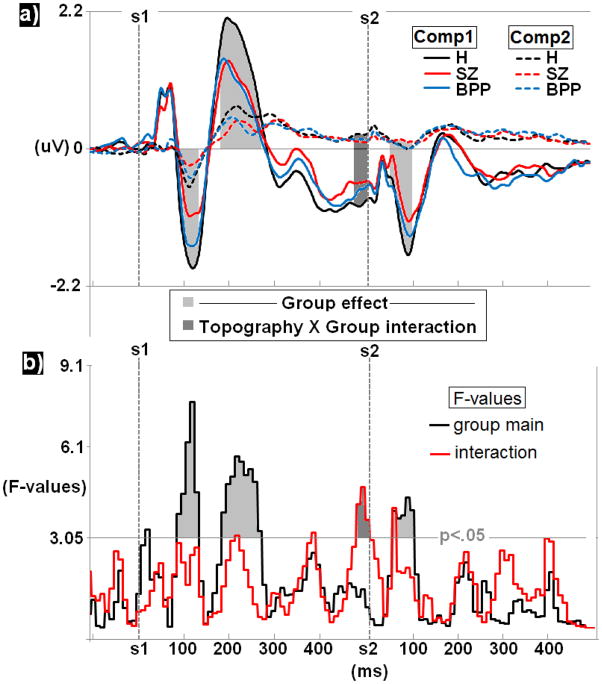
Figure 2.
Group comparisons for PCA derived ERP waveforms a) averaged within group yield significant effects in the N100-S1, P200-S1, pre-S2, and P50/N100-S2 ranges. b) F-values for these effects are also presented with highlighted significant regions extending above the p<.05 cutoff for 3 consecutive bins.

