
Figure 1.
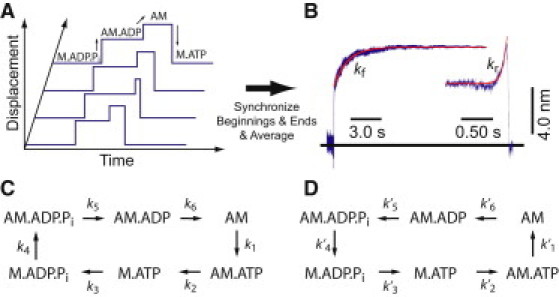
(A) Schematic displacement traces showing the two-step nature of actomyosin interactions in the optical trap. Biochemical intermediates are correlated with displacement states. (B) Ensemble-averaged interactions acquired at 25 μM MgATP (n = 805). Single attachments were synchronized at the times when the attachments start (left) or end (right). (Red lines) Fits of the averages to single exponential rate functions (kf = 0.77 s−1; kr = 14 s−1). (C) Forward and (D) time-reversed schemes for actomyosin attachment events.